
Predictive modelling and performance assessment with the caret package
Garth Tarr and Sarah Romanes
Note this was first published in the Biometric Bulletin:
- Tarr G and Romanes S (2019). Predictive modelling and performance assessment with the caret package. Biometric Bulletin, 36(1). International Biometric Society.
- You might also like to see Sarah Romanes R Ladies talk on Model Assessment.
The Classification and REgression Training (caret) R package was first published on CRAN way back in 2007, and despite it being incredibly useful, there are still far too many people who have never heard of it! The caret package provides a consistent interface to a huge variety of model training and prediction methods. At the time of writing there are 238 different methods available in the caret package ranging from standard linear regression, to random forests (or ferns), to eXtreme Gradient Boosting (xgboost) methods. The unified interface makes it easy to run a variety of methods, select tuning parameters, and compare performance.
For illustration purposes, let’s consider the glass data set from the mlbench package which has 214 observations with 9 variables (chemical elements) that can be used to predict the type of glass (there are 7 different types).
With the caret package, we will apply linear discriminant analysis (LDA), classification and regression trees (CART), support vector machines (SVM) and random forests (RF) to try to predict the type of glass. To build any predictive model, caret uses the train() function, which has this basic form:
train(formula, method, data)In the example below we specify:
- a model formula,
- a performance metric used to select the optimal model (overall accuracy),
- a preprocessing vector that specifies any preprocessing to be done to the predictors (center and scale),
- and training control specification that determines how the training of the model should be done.
Our training control parameter says that we would like to perform 10-fold cross validation, i.e. the data will be randomly split into 10 chunks, for each of the 10 chunks a model will be trained on the 9 remaining chunks and performance will be assessed against the accuracy relative to the held out chunk. The reported accuracies will be the average over the 10 iterations. In this way we get a better indication of the out-of-sample performance of each classifier than if we were to train and test on the same data set which might lead to over-fitting or at the very least overconfidence in the predictive ability of our model.
> library(caret)
> data(Glass, package = "mlbench")
> set.seed(1234)
> preproc <- c("center", "scale")
> control <- trainControl(method = "cv", number = 10)
> performance_metric <- "Accuracy"
> # Linear discriminant analysis (LDA)
> LDA <- train(Type ~ .,
+   data = Glass, method = "lda",
+   metric = performance_metric,
+   trControl = control, preProcess = preproc
+ )
> # Classification and regression trees (CART)
> CART <- train(Type ~ .,
+   data = Glass, method = "rpart",
+   metric = performance_metric,
+   trControl = control, preProcess = preproc
+ )
> # Support vector machine (SVM)
> SVM <- train(Type ~ .,
+   data = Glass, method = "svmRadial",
+   metric = performance_metric,
+   trControl = control, preProcess = preproc
+ )
> # Random forest (RF)
> RF <- train(Type ~ .,
+   data = Glass, method = "rf",
+   metric = performance_metric,
+   trControl = control, preProcess = preproc
+ )
> results <- resamples(list(LDA = LDA,  CART = CART, SVM = SVM, RF = RF))
> # summary(results)
We can collect the resampling results using the resamples() function. When we apply the summary() function to the results, a table of performance measures is printed out. However, we can also visualising these collected results using the ggplot() function, which shows that the random forest tends to perform best and linear discriminant analysis performs worst in terms of overall classification accuracy.
> ggplot(results) +
+   labs(y = "Accuracy") +
+   theme_linedraw()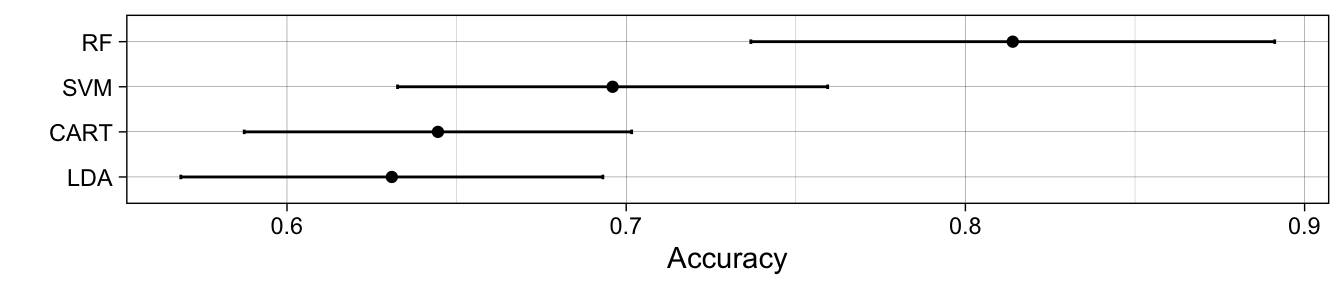
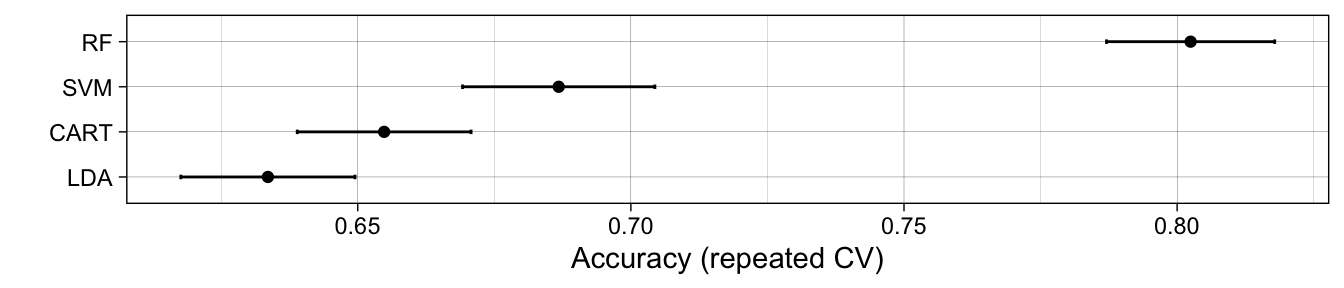
The most fantastic thing about the caret package, apart from the huge range of methods that it covers, is how easy it is to assess out-of-sample accuracy. In the above example, we have performed one round of 10 fold cross validation, however we know that results can vary from one cross validation iteration to the next, so if instead we wanted to perform repeated 10-fold cross validation, we simply update the trainControl() specification as follows:
> control <- trainControl(method = "repeatedcv", number = 10, repeats = 10)If we ran it all again, we would see results averaged over 10 repeats of 10-fold cross validation. This is a good idea because there is inherent randomness in any round of cross validation, so performing the whole procedure a few times (with a new random split each time) and averaging over the different splits leads to more reliable out-of-sample prediction accuracies (as can be seen with the narrower error bars).
For anyone who does predictive modeling, the caret package is well worth investigating. It is often the case that biometricians might not know, a priori, which algorithm is going to perform best for a given problem. The caret package makes it easy to switch between different methods and compare methods in a rigorous way. It also facilitates grid search over various parameters to help identify optimal parameter choices. The author, Max Kuhn, has created extensive documentation at this website and also has a book, Applied Predictive Modeling that covers many use cases in detail.
There are a few other packages that do similar things that are also worth checking out that aim to achieve similar functionality: