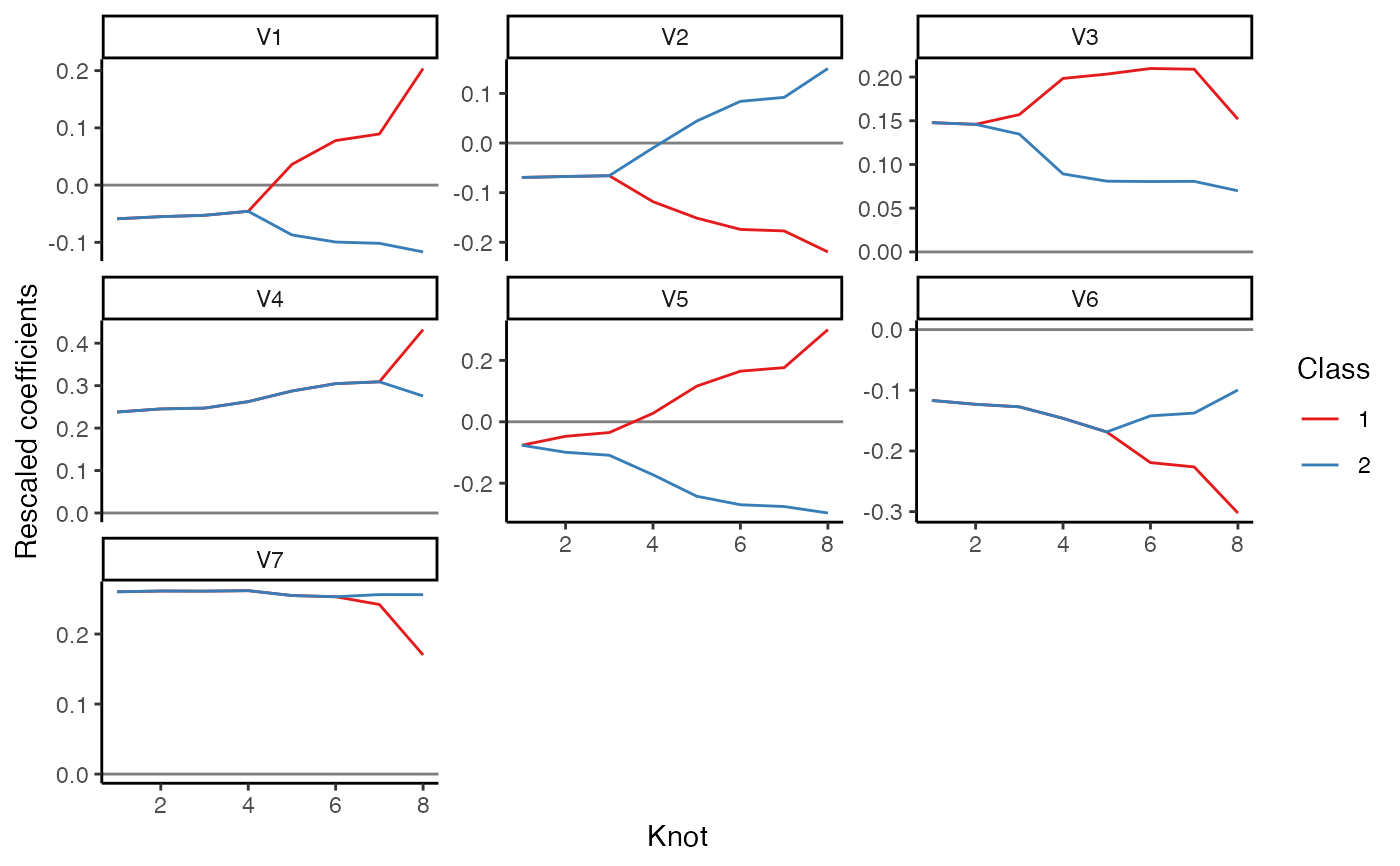
Plot the coefficient paths.
Arguments
- obj
an multiclass regression object (object of class mcreg)
- class_var
the name of the class variable in the data frame
- y_var
the name of the dependent variable in the data frame
- ...
additional arguments to be passed on to multiclass_reg()
Value
A list with the following components
- fit
fitted
genlassoobject- coef
matrix of estimated coefficients
- lambda
vector of regularization parameters along knots of regularization path
- K
number of classes
- p
number of predictors per class
- n
vector of sample sizes for each class
- Y
composite Y vector (stacked over the classes)
- X
block diagonal X matrix (each block coresponds to a class)
- var_indicator
matrix of variable indicators